

Which countries are most vulnerable to the industrial rise of China? Mapping Europe’s uneven exposure
Prepared by Ginevra Aguiari, Francesco Chiacchio, Matteo Falagiarda, Vanessa Gunnella and Emiel Cornelius Marchand
The rapid industrial transformation of China creates an uneven distribution of challenges and opportunities across EU economies. The so-called “China shock 2.0” combines a number of developments in China, including a rapid expansion of high-technology manufacturing, a stronger policy focus on industrial self-reliance and pervasive gains in price competitiveness. While these developments have intensified competitive pressures in some sectors, they may also benefit European economies through lower-cost imports, investment linkages and technological spillovers.[1] The balance of risks and opportunities differs across EU countries, reflecting differences in sectoral specialisation, integration into manufacturing value chains and exposure to sectors in which Chinese firms have rapidly expanded. Understanding this heterogeneity is important from a broader EU perspective, as asymmetric exposure to global shocks can have implications for competitiveness, investment and growth, as well as for macroeconomic convergence and the functioning of the monetary union.
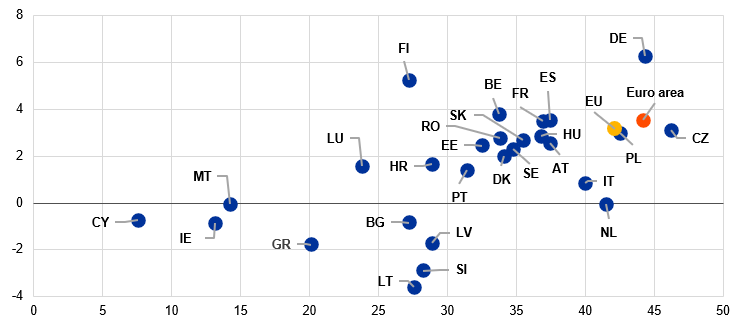
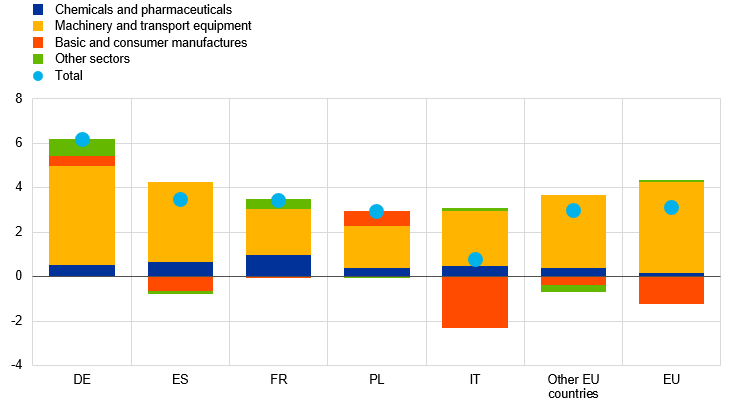
The similarity between the goods export structures of China and several EU countries has increased substantially in recent years. An index measuring the overlap between the sectoral composition of Chinese goods exports and that of each EU country points to rising export similarity across a number of EU countries.[2] The increase is most pronounced in manufacturing-intensive economies, such as Germany, while it is more limited in countries with more specialised export structures, including some smaller EU countries (Chart A, panel a). Sectoral evidence suggests that this increase was driven mainly by machinery and transport equipment (Chart A, panel b), reflecting the rapid rise of China’s automotive industry and a broader move up the value chain towards more advanced and technology-intensive products. This points to intensifying competition in sectors that have been key drivers of growth in some European economies over past decades, including automotive production and industrial machinery.
Chart A
Similarity between the EU’s and China’s goods exports
a) Export similarity with China in 2025 and change since 2019
(x-axis: similarity, percentages; y-axis: change, percentage points)
b) Sectoral contributions to changes in export similarity with China between 2019 and 2025
(percentage points and percentage point contributions)
Sources: Trade Data Monitor and ECB calculations.
Notes: The Export Similarity Index measures the overlap between the goods export structures of China and EU countries across sectors. Higher values indicate more similar export baskets. EU, euro area and “Other EU countries” aggregates exclude trade flows among countries within each aggregate. Panel b): Positive contributions indicate sectors in which export structures have become more similar over time, while negative contributions indicate increasing divergence. Sector classifications are based on Standard International Trade Classification (SITC) categories, with selected categories aggregated for presentation.
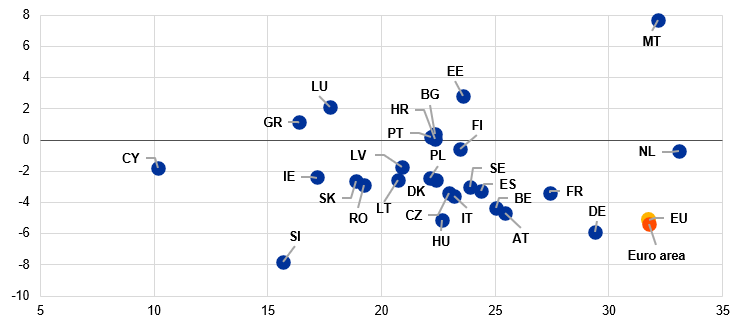
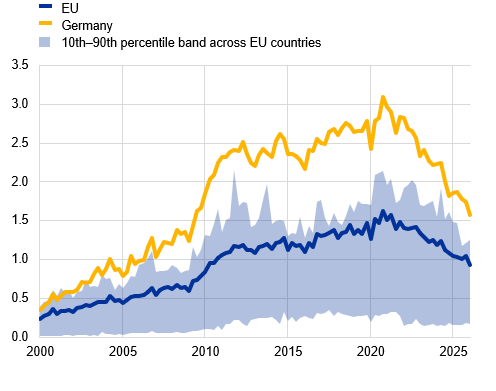
Alongside rising export competition, China appears to have become less dependent on European industrial imports. The similarity between the goods export structures of EU countries and Chinese goods imports has decreased across the EU since 2019 (Chart B, panel a). The fall is most pronounced in economies integrated into European manufacturing and automotive value chains, including Germany and several central European economies. This largely reflects developments in machinery and transport equipment (Chart B, panel b), sectors in which these economies are highly specialised. This is consistent with greater competition from Chinese producers, substitution by other foreign suppliers, shifts in the composition of Chinese demand and recent weakness in domestic demand in China. These developments have been accompanied by a marked decline in EU exports to China since 2019 (Chart C). While the decline is broad-based across EU countries, it has been particularly pronounced in Germany, reflecting the country’s specialisation in manufacturing and capital goods.
Chart B
Similarity between EU goods exports and China’s goods imports
a) Partner similarity with China in 2025 and change since 2019
(x-axis: similarity, percentages; y-axis: change, percentage points)
b) Sectoral contributions to changes in partner similarity with China between 2019 and 2025
(percentage points and percentage point contributions)

Sources: Trade Data Monitor and ECB calculations.
Notes: The Partner Similarity Index (de Soyres et al., 2025) measures the overlap between the goods export structures of EU countries and the sectoral composition of Chinese goods imports. Higher values indicate a closer match between EU exports and Chinese imports. EU, euro area and “Other EU countries” aggregates exclude trade flows among countries within each aggregate. Panel b): Positive contributions indicate sectors in which EU export structures have become more similar to the sectoral composition of Chinese imports over time, while negative contributions indicate increasing divergence. Sector classifications are based on SITC categories, with selected categories aggregated for presentation.
Chart C
EU exports of goods to China
a) EU exports to China |
b) Change in EU exports to China between 2019 and 2025 |
|---|---|
(percentages of GDP) |
(percentage points of GDP) |
 |
 |
Sources: Trade Data Monitor, Eurostat and ECB calculations.
Note: The chart shows 12-month cumulative exports to China as a percentage of nominal GDP.
Rising competition from China and declining Chinese dependence on European imports are weighing on EU export performance. Although global trade has continued to expand in recent years, the EU’s share in global goods exports has declined, particularly in sectors and destinations where China has strengthened its global presence, notably machinery and transport equipment (Chart D). In Asia, it is likely that China’s deep integration into regional supply chains and its growing strength in intermediate and capital goods are amplifying competitive pressure. In more price-sensitive third markets, Chinese firms may also be benefiting from cost advantages and broader product ranges.[3] By contrast, EU countries have increased their export market shares in the United States, while China’s share has declined, which may reflect trade reorientation linked to recent US-China trade tensions. These gains have been concentrated in higher-value-added sectors, highlighting areas in which European firms remain internationally competitive.
Chart D
Changes in EU and Chinese goods export market shares for selected products and destinations between 2019 and 2025
(changes in export market shares, percentage points)
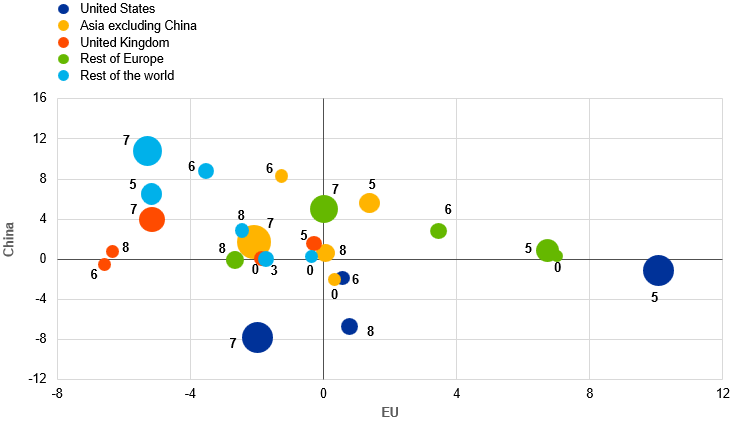
Sources: Trade Data Monitor and ECB calculations.
Notes: The bubbles refer to the following SITC sectors: 0 (Food); 3 (Energy); 5 (Chemicals and pharmaceuticals); 6 (Basic manufactures); 7 (Machinery and transport equipment); 8 (Consumer manufactures). The colour indicates the export destination, while the bubble size reflects the share in extra-EU exports in 2025. Only sectors accounting for more than 1% of extra-EU exports are shown.
The industrial rise of China is redefining global trade, leaving European economies unevenly exposed. While the aggregate picture is largely shaped by manufacturing-intensive economies, the effects vary considerably across countries and sectors. Economies specialised in machinery, transport equipment and other capital goods appear more exposed to rising competition from Chinese firms and declining Chinese demand for imported industrial goods. By contrast, some sectors have shown greater resilience so far, highlighting areas in which European firms remain internationally competitive.[4] In addition, some of the economies most exposed to rising competition from China are also highly reliant on sectors dependent on critical raw materials (Chart E), highlighting potential vulnerabilities in strategic supply chains and to Chinese export restrictions on these materials (Attinasi et al., 2025; Banin et al., 2025). Understanding the uneven impact of China’s rise across countries and sectors can help inform policy responses at the EU and national levels. For the most exposed economies, diversifying supply chains, strengthening domestic industrial capacity and fostering innovation may be important to enhance resilience and adapt to a changing global trade environment.
Chart E
Dependence on critical raw materials by country
(percentages)
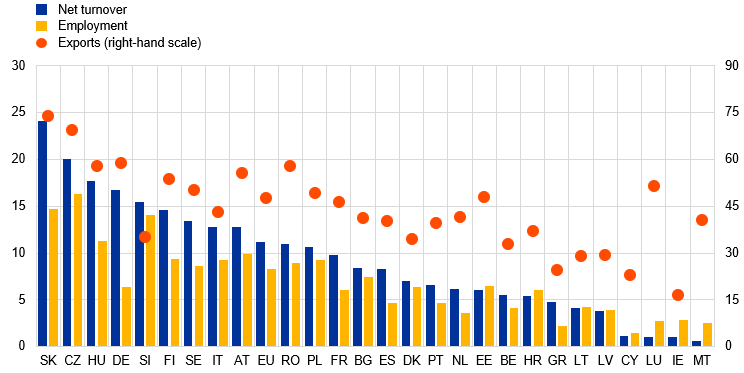
Sources: Eurostat, Trade Data Monitor and ECB calculations.
Notes: Blue bars show the share of firms’ net turnover in sectors dependent on critical raw materials (NACE sectors 24-30). Yellow bars denote the corresponding share of employment. Orange dots denote the corresponding share of total goods exports. Employment and turnover data refer to 2024; export data refer to 2025.
References
Al-Haschimi, A., Emter, L., Gunnella, V., Ordoñez Martínez, I., Schuler, T. and Spital, T. (2024), “Why competition with China is getting tougher than ever”, The ECB Blog, 3 September.
Amicucci, A., Gnocato, N., Gunnella, V., Lindemann, C., Merendino, A. and Montes-Galdón, C. (2026), “The impact of China’s industrial rise on the euro area”, Economic Bulletin, Issue 3, ECB.
Anaya Longaric, P., Esposito, C., Gunnella, V., Lecourt, N., Martínez Hernández, C. and Pongetti, G. (2026), “What has kept goods inflation low? The role of the import exposure to China”, Economic Bulletin, Issue 4, ECB.
Attinasi, M.-G., Boeckelmann, L., Gerinovics, R. and Meunier, B. (2025), “Unveiling the hidden costs of critical dependencies”, Economic Bulletin, Issue 5, ECB.
Banin, M., D’Agostino, M., Gunnella, V. and Lebastard, L. (2025), “How vulnerable is the euro area to restrictions on Chinese rare earth exports?”, Economic Bulletin, Issue 6, ECB.
de Soyres, F., Fisgin, E., Gaillard, A., Santacreu, A.M. and Young, H. (2025), “The Sectoral Evolution of China’s Trade”, FEDS Notes, Board of Governors of the Federal Reserve System, 28 February.
Finger, J.M. and Kreinin, M.E. (1979), “A Measure of ‘Export Similarity’ and Its Possible Uses”, The Economic Journal, Vol. 89, No 356, December, pp. 905-912.
Lane, P.R. (2026), “Europe and the world economy”, keynote speech at the Asian Monetary Policy Forum, Singapore, 22 May.
Legal Disclaimer:
EIN Presswire provides this news content "as is" without warranty of any kind. We do not accept any responsibility or liability for the accuracy, content, images, videos, licenses, completeness, legality, or reliability of the information contained in this article. If you have any complaints or copyright issues related to this article, kindly contact the author above.
